50 US tech & growth stocks · Updated every 30 min

Stop losing to your own mistakes.

The average investor loses 2–4% a year to panic selling and impulse buys — not bad stock picks. StoxEye guards your discipline: a demo account to practice on, a trade journal that asks why, and honest momentum‑led data.

🔒 Closed beta — only 45 of 50 spots remaining
🚀 See today's top stocks — free, no sign-up
No credit card needed · Cancel anytime ·
✓ Real market data · Updated every 30 min · No credit card to start
0 StoxEye Score
NVDA Strong Buy
TrendBullish
Support$134.80
Resistance$158.20
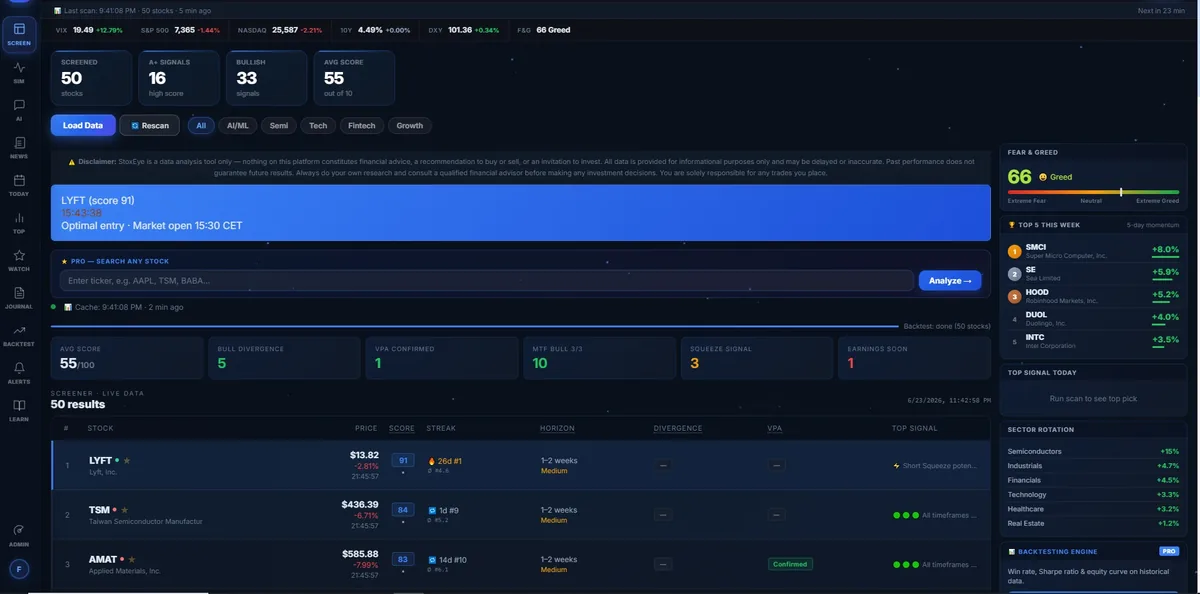
StoxEye Dashboard
StoxEye Score 0–100
Momentum-led ranking, distilled into one clear number
Spot weak setups fast
See when momentum and fundamentals don't align
Support & Resistance
Key price levels calculated from real market data
📊
26,400
stocks analyzed this month
30 sec
average research time
🎯
50+
signals per stock
See it in action

Your trading dashboard,
built for speed

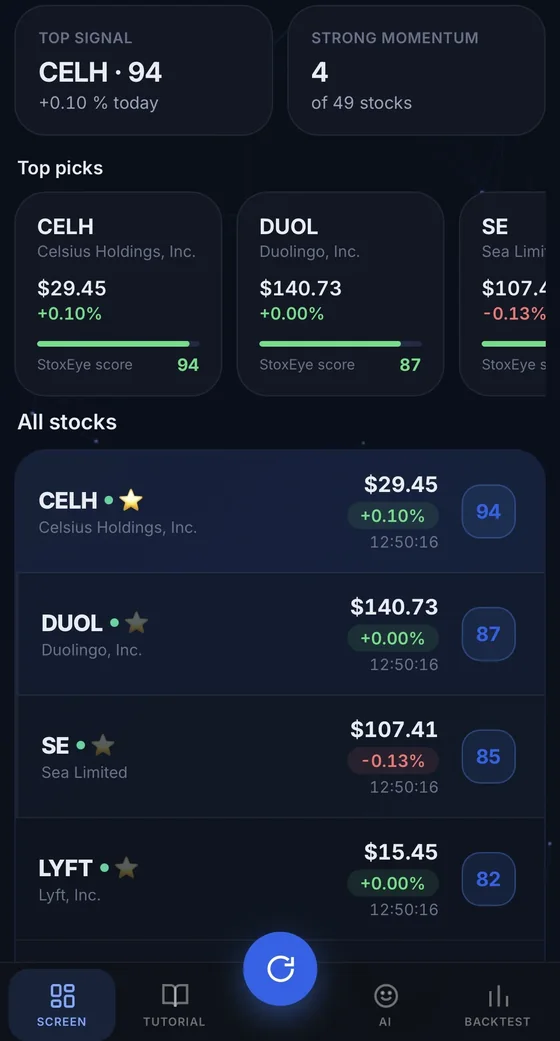
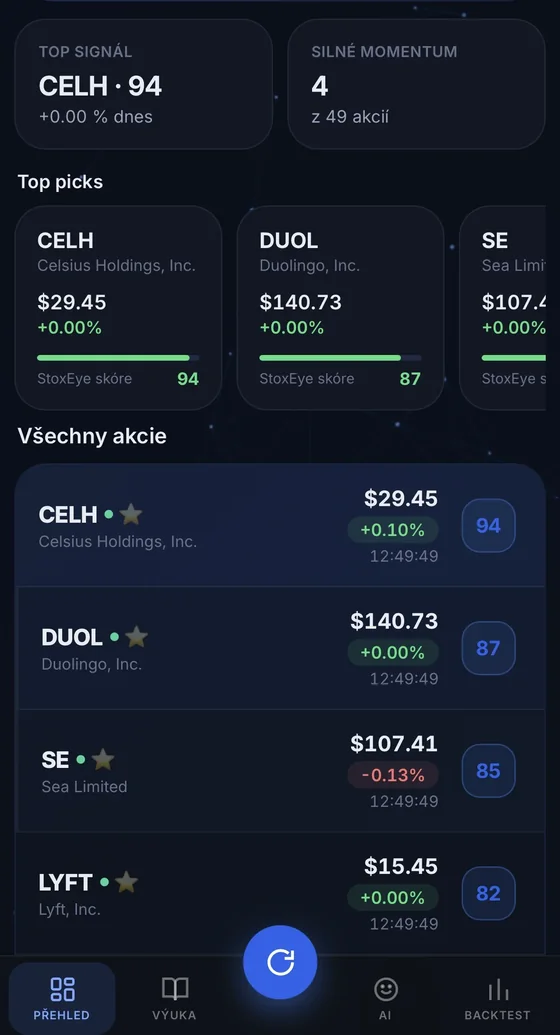
Real screenshots from the StoxEye app. Every signal, chart, and score — at a glance.

Click tabs or arrows to browse · Dark mode shown

Strategy robustness

300 simulated portfolios.
Real daily returns.

We took real daily stock returns and resampled them randomly to simulate 300 different portfolio paths over one year. Each path picks a random subset of stocks (1–15), random trading costs, and draws returns with replacement. Some win, some lose — just like real trading.

Paths
Median
Worst
Best
P5
P95
Profitable
Generating 300 Monte Carlo paths...
Profitable paths (above $100)
Losing paths (below $100)
Median path
Best path
Worst path
Starting equity ($100)

Bootstrap Monte Carlo · Daily returns sampled with replacement from real stock data · Random portfolio size (1–15 stocks) · Trading costs 0.05–0.3% · 252 trading days · Starting equity: $100 · Not financial advice

Pricing

Simple, transparent pricing

Monthly Annual Save 17%
Free
For Everyone
$0/ month
Register with email or Google
Included
  • Top 3 stocks per scan
  • Composite AI signal score
  • Basic technical indicators
  • News headlines & macro bar
  • Fear/Greed index
  • Watchlist (up to 5 stocks)
  • Discord community
Pro features
  • Full 50-stock ranking
  • Advanced indicators & AI chat
  • Backtesting Engine
  • Price alerts & journal
Pro
Most Popular
$9.99/ month
Register with email or Google
Everything in Free, plus
  • All 50 stocks ranked
  • Search & analyze any stock
  • 50+ technical indicators
  • Macro, FRED & options flow
  • AI chat assistant
  • Price alerts via Discord DM
  • Unlimited watchlist & journal
  • Dark pool & short interest
  • Paper trading + Export CSV/JSON
  • Discord Pro role
⭐ Exclusive
  • 📊 Backtesting Engine Only here
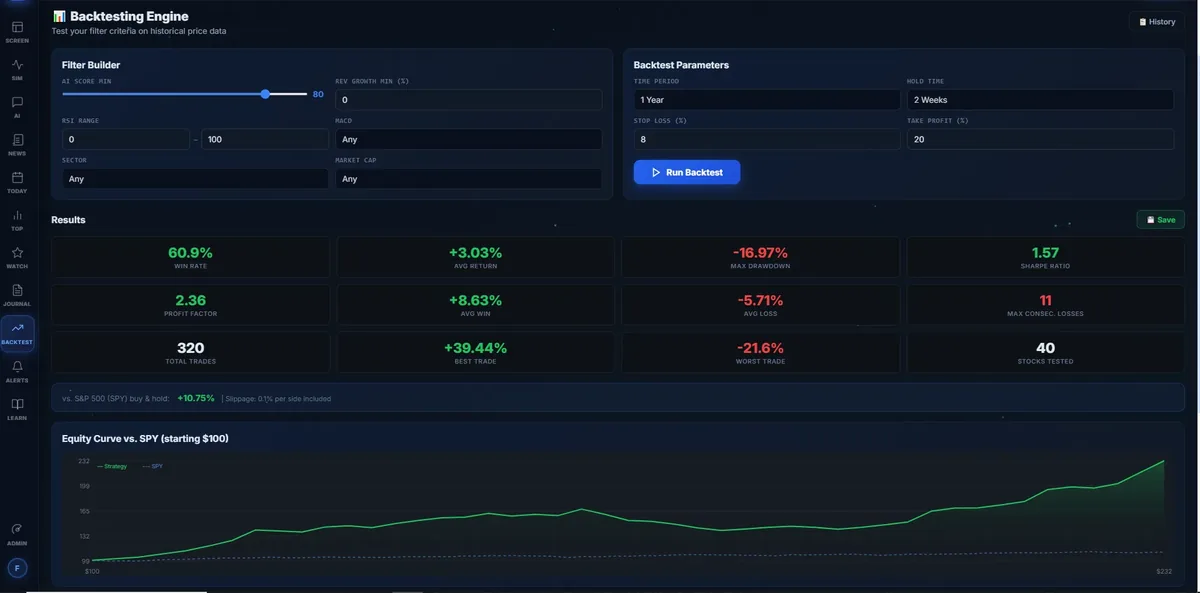
    Win rate, Sharpe ratio & equity curve on real data

Annual plan: $99.99/year — save 17% · Switch anytime

Reviews

What our users say

Real feedback from real traders using StoxEye every day.

Loading reviews…
The difference

How long does your
stock research take?

Most traders spend 30+ minutes before making a single decision.
StoxEye compresses that into 30 seconds.

😤 Without StoxEye
Read 5+ news articles
…and still not know if the setup is valid
Manually check fundamentals
Revenue growth, margins, P/E — tab by tab
Open TradingView
Draw RSI, MACD, Bollinger, support levels…
Check options flow & dark pool
Another paid tool, another tab
Guess your entry & exit
No objective data, just gut feeling
VS
With StoxEye
StoxEye Score 0–100
Momentum-led ranking merged into one number. Instantly.
Entry Timing
Low / Medium / High retest risk — know exactly when to buy
Exit Targets
Fibonacci levels, ATR-based stop loss, take profit zones
Institutional Flow Score
Dark pool, insider buys, hedge fund positioning — all in one
Backtest your strategy Only here
Prove the strategy worked before risking real money
Start Free 7-Day Trial → 7 days free  ·  Then $9.99/mo  ·  Cancel anytime before trial ends
The StoxEye Score

One number that
tells the whole story

Every stock gets a composite score from 0 to 100. It aggregates dozens of signals so you don't have to.

📈
Technical momentum
RSI, MACD, Bollinger Bands, EMA cross, StochRSI, volume analysis, multi-timeframe.
📊
Fundamental quality
Revenue growth, FCF yield, P/E ratio, ROIC, debt levels, earnings history.
💬
Sentiment & positioning
News sentiment, options flow, short interest, institutional ownership, Google Trends.
🌍
Macro context
Fed rates, yield curve, inflation, sector rotation, Fear & Greed index.
Live scan · Top ranked
NVDA
NVIDIA
88
MSFT
Microsoft
82
META
Meta
79
PLTR
Palantir
64
INTC
Intel
31
For informational purposes only. Not investment advice.
Features

Everything you need to
analyse any stock

Pro plan gives you the full picture — all data sources, all indicators, all tools.

📈
Technical Analysis
Price action, momentum, and volume signals — calculated fresh every 30 minutes across all timeframes.
RSIMACDBollingerEMA CrossStochRSIATR
📊
Fundamental Data
Separate quality companies from mediocre ones using key financial metrics updated from earnings data.
P/E ratioFCF YieldRevenue growthROICDebt/EBITDA
💬
Sentiment Signals
Real-time news sentiment analysis, unusual options flow, short interest, and institutional ownership trends.
News NLPOptions flowShort interestInst. ownership
🌍
Macro & Sector
Federal Reserve data, yield curve, inflation, CPI, and sector rotation context for every stock.
FRED dataYield curveFear & GreedSector heat
🤖
AI Chat Assistant
Ask the AI analyst anything about a stock — it reads the full scan data and explains its reasoning in plain language.
Per-stock contextSetup analysisRisk assessment
🔔
Price Alerts
Set price or score thresholds and get notified via Discord DM the moment a stock hits your target.
Price above/belowScore alertsDiscord DM
Watchlist & Journal
Track your favourite stocks, log trades, and review your performance with win rate, R:R ratio, and P&L stats.
Custom watchlistTrade journalPerformance stats
📋
Paper Trading
Simulate trades on screener picks with a virtual portfolio. Test your strategy before risking real capital.
Virtual portfolioP&L trackingHistory
📉
Advanced Indicators
Fibonacci retracements, beta, VPA (Volume Price Analysis), dark pool data, reflexivity index, and more.
FibonacciDark poolVPAReflexivity
Powered by
📡 Yahoo Finance
🏛️ FRED (Federal Reserve)
🦔 Finnhub
🔷 Polygon.io
📊 Google Trends
💳 Stripe Payments
Stock detail · NVDA
Overview
Technical
Fundamental
Sentiment
88
/ 100 · Composite Score
Price$134.82
Change+2.4%
RSI (14)61.2
MACD SignalBullish
Revenue Growth+122%
Win probability74%
Horizon7–14 days
Target price$149.00
Stop loss$126.50
Data for illustration only · Not investment advice
Full stock detail

Four research tabs
for every stock

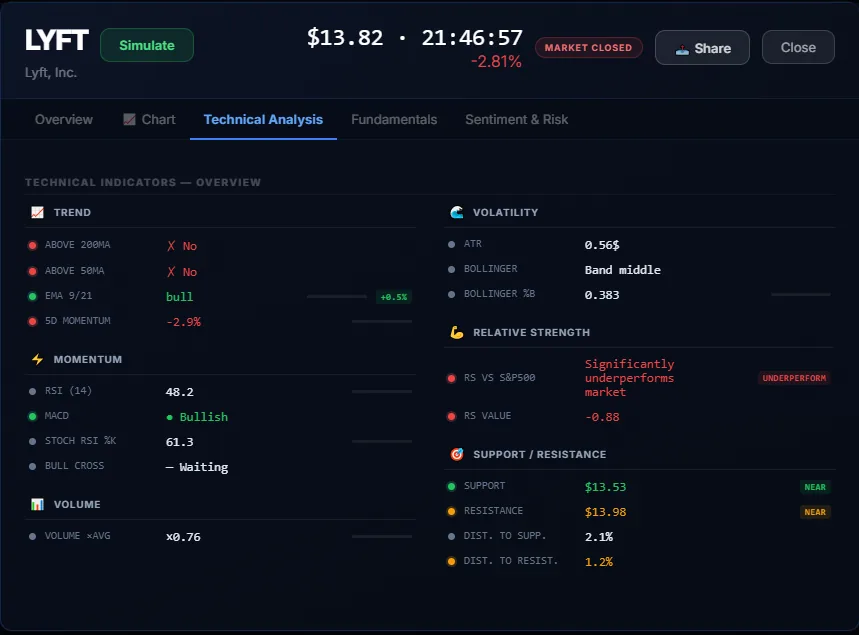
Click any stock in the screener to open the full detail view with tabs for each research angle.

  • Overview tab — Score breakdown, horizon, target price, stop loss, win probability, retest risk analysis.
  • Technical tab — All indicators, support/resistance levels, multi-timeframe analysis, VPA, Fibonacci.
  • Fundamental tab — Revenue, margins, FCF, P/E, analyst targets, earnings history, seasonal patterns.
  • Sentiment tab — News feed with NLP scores, options flow, short interest, institutional ownership, dark pool.
  • AI Assistant — Ask anything about the stock, get plain-language explanations of the data.
How it works

Up and running in 60 seconds

1
Create a free account
Register in under a minute. No credit card required for the free plan.
2
Run the screener
StoxEye scans 50 US tech stocks and ranks them by composite score. Updated every 30 minutes.
3
Deep-dive any stock
Click any ticker for a full 4-tab breakdown: technical, fundamental, sentiment, and macro context.
4
Set alerts & track
Add stocks to your watchlist, log trades in the journal, and get Discord DM alerts when targets are hit.
FAQ

Common questions

StoxEye covers 50 US tech and growth stocks — including NVDA, MSFT, META, AAPL, AMD, TSLA, PLTR, COIN, SHOP, and more. The list focuses on high-liquidity names where algorithmic signals are most reliable.
The screener runs a full scan every 30 minutes during market hours. Live prices are streamed in real time via Finnhub. Fundamental data is updated when new earnings are released.
No. StoxEye is a data research and screening tool. Nothing on this platform constitutes financial advice or a recommendation to buy or sell any security. Always do your own research and consult a qualified financial advisor before making investment decisions.
Pro users can set price or score thresholds for any tracked stock. When the next scan detects a trigger, StoxEye sends a Discord DM to your linked Discord account. You need to link your Discord in Settings to receive alerts.
Yes, anytime. Cancel through your Stripe billing portal — no questions asked. You keep Pro access until the end of your billing period.
The Trading Journal is a personal trade log. You can record entry/exit prices, position size, stop loss, take profit, setup type and notes. StoxEye automatically calculates P&L %, win rate, average win/loss, and R:R ratio across all your trades.
Community

Top analysts on StoxEye

Real users earning XP by screening, journaling, and researching smarter every day.

Loading…

Start researching smarter today

Get full Pro access free for 7 days — enter your card, cancel anytime before the trial ends and pay nothing.

🎁 7 days free  ·  Then $9.99/mo  ·  Cancel anytime

Not financial advice. StoxEye is a data research and screening tool only. Nothing on this platform constitutes financial advice, an investment recommendation, or a solicitation to buy or sell any security. All data is provided for informational purposes only. Past performance is not indicative of future results. Always consult a qualified financial advisor before making investment decisions. Trading involves significant risk of loss.

Sign in to your account
or
Don't have an account?